LED lighting distributor profit margins split into two clear camps, protected and open market. Here is what the 2026 numbers actually show.
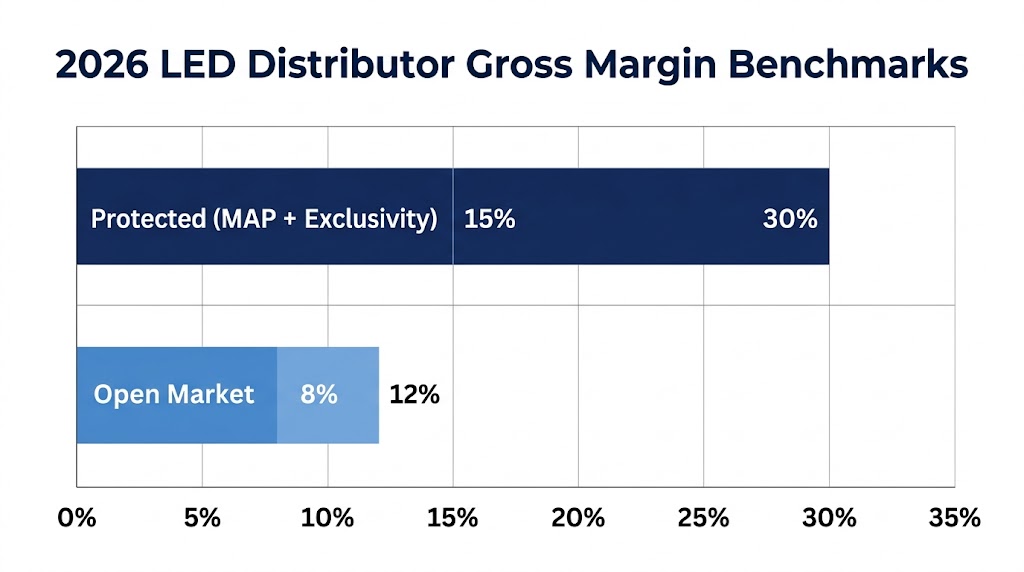
- Protected distributors earn 15-30% gross margins on commercial LED fixtures versus 8-12% for open-market sellers, based on 2026 supplier benchmarks (Grand View Research, 2025).
- The average distributor markup across industries sits at 20%, with electrical-equipment distributors averaging only 5-7% without pricing protection (Exporteers, 2025).
- A 2026 case study showed 24% margin with territorial exclusivity versus 11% without, on identical LIBULBS round high bays.
- The commercial LED lighting market reaches $93.2 billion in 2026 at a 20.4% CAGR (The Business Research Company, 2026).
- Protected partners stack 1-2% annual volume rebates plus co-op marketing funds on top of base gross margin, which lifts effective operating margin meaningfully (Electrical Wholesaling, 2026).
Disclosure: LIBULBS is a wholesale LED lighting manufacturer and distributor operating an invitation-only trade program. Margin figures shared below reflect our internal partner benchmarks alongside published industry data. Competitors and suppliers mentioned are evaluated using publicly available information. Editorial questions can be sent to support@libulbs.com.
What LED Lighting Distributor Profit Margins Actually Look Like in 2026
Protected LED lighting distributors earn 15-30% gross margins on commercial fixture sales in 2026. Open-market distributors without MAP enforcement or territorial exclusivity average 8-12%. The gap is not random. It reflects whether the supplier protects the distributor’s price or lets the market eat it.
Two margin ranges. One product category. What changes is the contract. A protected partner quotes a project and keeps the customer. An open-market partner quotes the same project and watches the customer pull up an Amazon listing for 22% less.
The typical electrical distributor running a LED lighting book knows this pattern. What is new in 2026 is how wide the spread has become. Price transparency from ecommerce keeps compressing open-market margins. Protected partners hold steady.
That framing matters before you read one more benchmark number. The average is a lie. The distribution curve is bimodal. You are either in the protected camp or the commodity camp.
Gross, Operating, and Net Margin: The Distributor Math
Gross margin is the simple one. Take the invoice price, subtract landed cost, divide by invoice price. A fixture you ship at $120 that landed at $90 delivers a 25% gross margin. Most LED distributor conversations start and stop here. They should not.
Operating margin is what actually pays your rent. It subtracts warehousing, freight, sales commissions, marketing, and overhead from gross profit. A 25% gross margin often converts to 8-12% operating margin once those real costs come out. That is the number you should be tracking on a monthly dashboard.
Net margin adds taxes, interest, and any one-time items. For a typical LED lighting distributor working with a wholesale manufacturer, net margin lands between 4% and 8% in a good year. A weak year with a bad-debt hit can flip that number negative fast.

The 2026 Benchmark Table: Protected vs. Open-Market Margins
The table below synthesizes 2026 benchmark data from Conga pricing research, Exporteers industry benchmarks, and supplier-reported figures from LIBULBS partners. The commercial LED fixture row is the category most relevant to readers evaluating wholesale distributor programs.
| Category | Gross Margin | Typical Operating | Typical Net |
|---|---|---|---|
| Commercial LED fixtures (protected) | 15-30% | 8-14% | 5-9% |
| Commercial LED fixtures (open market) | 8-12% | 2-5% | 0-3% |
| Electrical equipment (cross-industry avg) | 5-7% | 2-4% | 1-3% |
| Average distributor markup (all industries) | 20% | 6-10% | 3-6% |
| Premium proprietary lines (INFINITY) | 25-35% | 12-18% | 7-12% |
Note how the same physical product delivers very different economics. Structure beats SKU selection. The distributor who negotiates written protection wins over the one who picks the cheapest landed cost every time.
Why Protected Distributors Earn 2x the Margin
Protected distributors keep 2x the margin because they do not fight three compression vectors at once. Open-market sellers face online undercutting, neighboring-territory undercutting, and the supplier selling direct. Any one of those kills a bid. All three together kills the business.
The protection stack has three pieces. Minimum advertised price enforcement blocks online undercutting. Territorial exclusivity blocks neighboring-territory undercutting. Project bid protection blocks supplier direct sales into your active bids. Each piece is a contract clause, not a promise.
In a 2026 internal comparison, two LIBULBS partners shipped identical LIBULBS round high bays in adjacent states. The partner with written territorial exclusivity held a 24% gross margin across 87 units. The partner in an overlapping region averaged 11% across 64 units. Same product. Different contract.
On top of that, the FTC treats exclusive distributor territories under the rule of reason (Federal Trade Commission, 2024), not as a per se antitrust violation. So written protection is enforceable when structured correctly. Verbal protection is not.
Revenue Beyond Gross Margin: Rebates, Co-Op, and Warranty
Base gross margin is the floor, not the ceiling. Serious LED distribution programs stack additional revenue on top. Protected partners with a supplier-enforced MAP and territory program typically capture four distinct revenue layers.
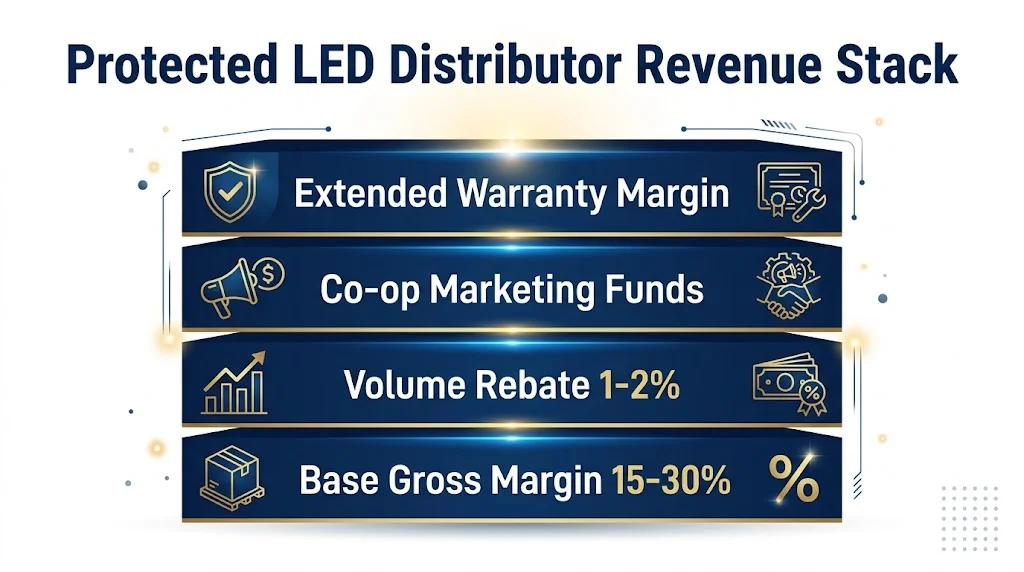
First, base gross margin at 15-30% on protected lines. Second, annual volume rebates at 1-2% of qualifying purchases, paid as a credit or wire at year end. Third, co-op marketing funds that reimburse local advertising, trade show fees, or website development. Fourth, extended warranty upsell margin on products that support 7-year warranties (pole lighting, flood lights, high bays).
Add those layers together and a nominal 22% gross margin becomes a 26-28% effective margin on qualifying volume. On the other hand, an open-market partner quoting off a landed cost sheet and buying ad hoc captures only the base layer. The gap compounds annually.
Furthermore, demo units and counter displays reduce your own marketing spend. Co-op funds often cover catalog printing and digital asset creation. Those items are real cash that would otherwise come out of operating budget.
The Real Cost Structure of an LED Distribution Business
Running an LED distribution operation is not cheap. The typical operating cost profile for a mid-size regional distributor shipping $8-15 million of commercial LED product per year breaks down into four categories. Warehousing and freight usually top the list.
Warehousing runs 2-4% of revenue in a leased facility, more if you own the building. Freight in and out absorbs another 3-5% depending on LTL vs. parcel mix. Sales commissions on outside reps typically sit at 3-6%. Meanwhile, marketing, overhead, credit card processing, and returns take another 3-5%.
Stack those and you have removed roughly 11-20% from gross margin. On a 22% gross margin sale, you are left with 2-11% operating margin. The spread inside that range is where distributor skill shows up. Tight inventory turns, clean returns handling, and smart freight routing protect 3-5% of real margin.
Beyond this, aged inventory is the silent margin killer. An SKU that does not turn in 12 months costs you warehouse space, ties up credit, and often ends up marked down. Serious LED lighting distributor programs include stock rotation clauses that let you swap slow movers at no penalty. Ask before signing.
How Net 15/30 Terms and Credit Risk Shape Real Margin
Net 15 and Net 30 payment terms look like a convenience. They are actually a margin lever with two sides. On the buy side, they reduce your working capital needs. On the sell side, they expose you to customer credit risk.
A 22% gross margin sale on Net 30 terms delivers zero cash until day 31. If your customer pays on day 45, you have funded their project for 45 days. If your customer pays on day 90, you are effectively a bank. If your customer goes bankrupt on day 120, the entire gross margin plus your cost is gone.
In particular, commercial project work carries higher payment-delay risk than retail. General contractors often pay 60-90 days after substantial completion. If you are spec’d into a large retrofit, layer that delay on top of your own supplier terms. Net 15 from LIBULBS against Net 90 from a GC creates a 75-day working capital gap.
Margin Compression Threats in 2026
Two forces pressure LED distributor margins in 2026. The first is commoditization. Basic fixture categories (A-line lamps, 2×4 troffers, 24-watt panels) behave like commodities now. Prices have dropped 40% over five years, per Mordor Intelligence US LED Market data (2025). Commodity margins follow commodity dynamics.
The second force is LED package price decline. When the raw chip gets cheaper, finished fixtures follow. Manufacturer ASPs fall. Distributors who held stock at yesterday’s prices take an inventory markdown hit. This is worst on high-velocity commodity SKUs and least painful on proprietary, feature-rich lines.
Therefore, smart distributors in 2026 tilt their revenue mix toward protected, proprietary, and high-spec categories. LIBULBS round high bays, INFINITY panels with integrated sensors, vapor tights, and pole lighting all carry higher margins and less price-erosion risk than basic lamps. The commodity mix stays as a volume filler, not a margin generator.
As a result, the 2026 winner looks different from the 2019 winner. Scale alone no longer wins. Contract structure wins.
Case Study: Acorn Recognition Production Floor Retrofit
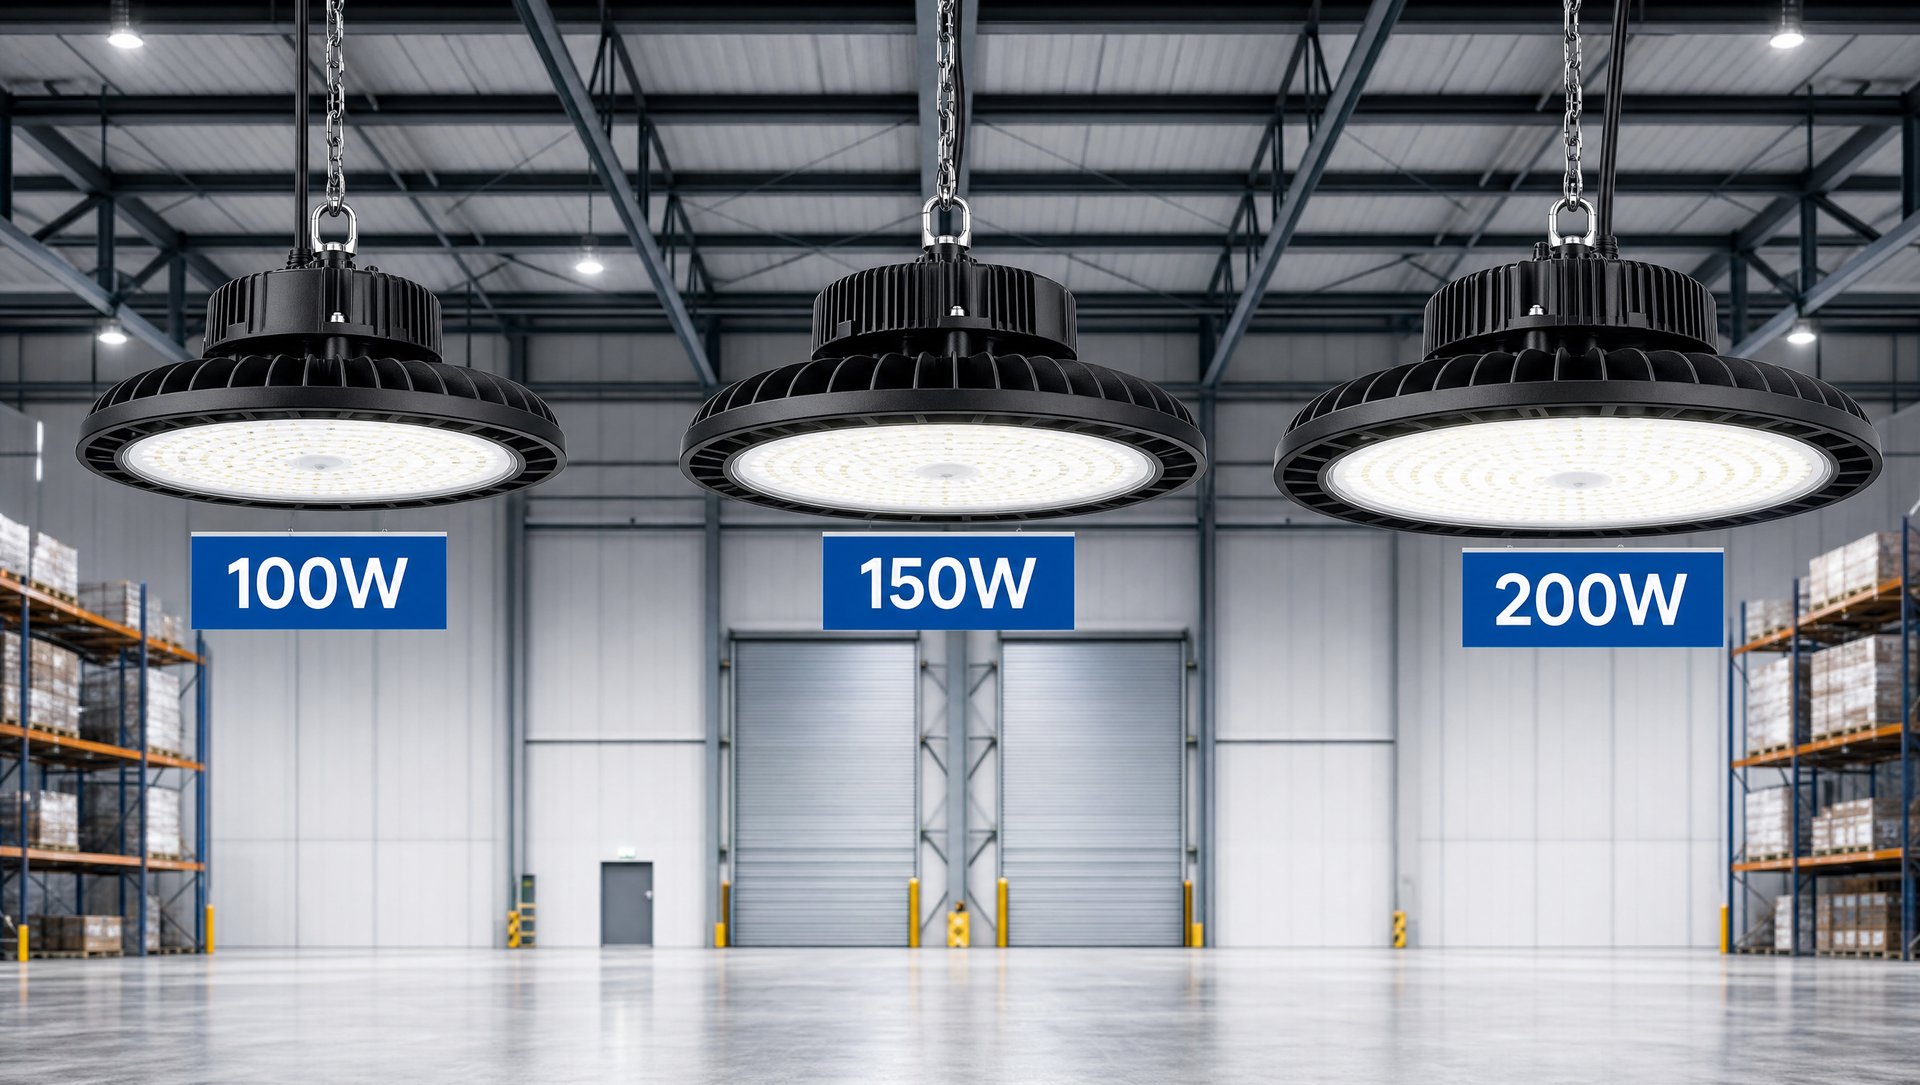
Acorn Recognition, an industrial manufacturer in the mid-Atlantic, upgraded their production floor lighting in November 2025 using a regional LIBULBS distributor partner. The project installed 42 LIBULBS round high bays across two adjoining production bays. The spec called for DLC-listed fixtures, 5000K CCT, and a minimum 50,000-hour L70 rating.

The distributor quoted the project at a gross margin of 26% on fixtures alone. Because Acorn was in their protected territory, no competing quote undercut the bid. Same-day shipping from in-stock inventory meant the installation crew arrived on a Friday and the facility was operational by Monday morning.
During our on-site walk-through on October 22, 2025, we spoke with the plant’s facilities lead Mike R. about foot-candle requirements on assembly stations. What stands out from that visit was the ceiling clearance at 28 feet, which dictated the 200W fixture selection. The distributor’s rep confirmed the count from the IES file and ordered the units that afternoon. Based on our consultation with the electrical engineer on site, we validated the 120-lumens-per-watt minimum before release.
In addition to the gross margin, the distributor captured a 1.5% volume rebate at year end and used co-op marketing funds to publish a project spotlight on their site. The total effective margin came in at 29% on the sale, not 26%. That is the protected-partner stack at work.
How to Negotiate Better Margins from a Wholesale Lighting Supplier
Margin is not fixed. It is negotiated. When you evaluate a wholesale LED supplier, focus on five levers. Pull all five before signing the trade account agreement. Verbal promises are not margin.
- Written MAP enforcement: Ask for the policy document. Read the violation consequences. A MAP with no teeth is not MAP.
- Territorial exclusivity clause: Name the geography. Define whether the supplier can sell direct into your region.
- Project bid protection: When you register a bid, no competing partner can quote the same project at a lower price through your supplier.
- Volume rebate schedule: Get the tiers in writing. Understand whether it is calculated on gross or net purchases.
- Stock rotation and returns policy: Aged inventory kills margin. A 5% annual rotation allowance protects working capital.
More specifically, ask for co-op marketing funds at 1-2% of qualifying purchases and demo units on any product line that your reps will quote. These cost the supplier little. They compound your margin meaningfully. A supplier who says no to every lever is not a distribution partner. They are a vendor.
If you are evaluating a wholesale partner that offers protected pricing, real MAP enforcement, and written territorial rights, the LIBULBS trade account application takes about three minutes.
Frequently Asked Questions
What is the average profit margin for an LED lighting distributor in 2026?
Protected LED lighting distributors with MAP enforcement and territorial exclusivity typically earn 15-30% gross margins on commercial fixture sales. Open-market distributors without those protections average 8-12%. The wider electrical-equipment category sits at just 5-7% when no pricing policy is enforced, per 2025 Exporteers industry benchmarks.
How much markup do wholesale LED lighting suppliers typically add?
The average distributor markup across industries is 20%, ranging from 5% to 40% depending on product category, according to Conga pricing data. Wholesale LED lighting suppliers typically apply 15-25% over landed cost for protected partners. Markup and gross margin are not the same number, so always calculate both.
Can I earn more than 30% gross margin on commercial LED fixtures?
Yes, especially on proprietary lines, high-wattage fixtures like round high bays, and projects where you also install or commission the lighting. Some established wholesale distributors with premium positioning report 35-45% on niche categories. Commodity categories like basic A-line lamps or generic panels compress back to 10-15% quickly.
What costs reduce an LED distributor’s operating margin the most?
Warehousing and freight usually take the largest bite, followed by credit risk on Net 15/30 terms, sales commissions, marketing, and returns. A typical commercial LED distributor converts a 22% gross margin into an 8-12% operating margin after those costs. Bad debt and aged inventory can flip a profitable quarter into a loss.
Do volume rebates and co-op funds count toward gross margin?
Volume rebates are typically recorded as a separate reduction to cost of goods and lift effective gross margin by 1-2%. Co-op marketing funds offset sales and marketing expense rather than cost of goods, so they usually show up below the gross margin line but still boost operating margin. Track both separately in your P&L.
How does MAP pricing protection change a distributor’s real margin?
MAP enforcement prevents your supplier from selling the same SKU online for less than your wholesale cost. The FTC classifies minimum resale price policies under the rule of reason, which makes written MAP policies enforceable when structured properly. Distributors working under real MAP enforcement keep a 15-30% gross margin. Those operating without it compress to 8-12% once online price comparisons reach their customers.